The 2024-25 PWHL season is upon us, and with it, new playoff predictions. I describe my method this year in the next few paragraphs, so for those uninterested in the math or data, skip to the beautiful figure made by An Nguyen for the results.
Similar to last year’s prediction method, I started with converting each team’s win-loss record into the PWHL points system. I next calculated the percentage of available points a team won in a given season and then the percentage of points a team won in the season previous to that. Teams in their first year of existence or with COVID/bubble seasons were dropped from the dataset. I also dropped the 2015 Boston Blades and the 2021 Connecticut Whale. In 2015-16 season, the Blades lost a huge chunk of their roster to the newly formed NWHL (later PHF). In the 2021-22 season, the Connecticut Whale vastly improved after being bought by Shared Hockey Enterprises (SHE) LLC and receiving more behind the scenes investments. Neither of these things happen in most offseasons, so they were not included in the dataset.
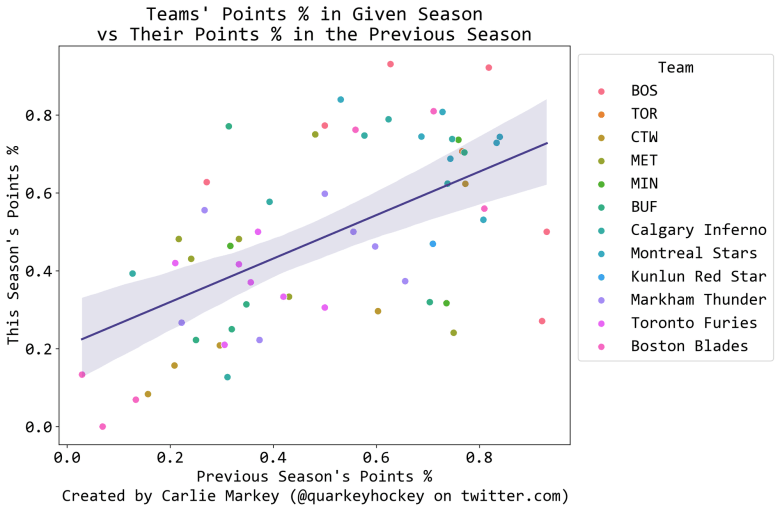
Plotting a team’s points percentage from a given season versus the one before it demonstrates a weak correlation between the two. There are many other factors that affect a team’s success year-to-year that I am unable to include in the model at this time that would improve the predictive power. These include roster turnover, addition of rookies, coaching changes, etc.
Given that we do have a correlation to go on, I followed the same methodology as last year which was to do a Monte Carlo simulation with the linear regression above. Using the model in the image, I generated an estimate and standard deviation for their points percentage this year based on each team’s points percentage last year. I created a normal distribution based on this estimated mean and standard deviation and sampled from it 10,000 times. AKA, I simulated each team’s season 10,000 times. Using these results, I was able to create probabilities of each team ending up in first, second, third, etc. place in the standings.
The results are below, once again beautified by our resident viz maker An Nguyen.

If possible, this is going to be an even tighter race for the playoffs than last year. The middle four teams are going to be locked up in a tight race to not be the odd-man out in fifth place.
Toronto is the clear favorite to make the playoffs, based on how good teams historically did after good years. Montréal has the obvious edge of the middle four with finishing so high last year.
Boston and Minnesota have essentially identical odds, given they had the same record last year. The variation seen between them in the probabilities are caused by random variation, and I expect them to further separate themselves from each other as the season starts.
Ottawa looks to be a wildcard this year, with the odds having them tip either way. Their season odds will be largely shaped with how the start in the first five games I suspect.
The team I’d like to add a caveat to is New York. The model tends to predict that teams that captured few available points last year will continue that trend this year. Based on the high-calibre players they drafted and impactful European talent that they brought in, I can easily see them having a 2021 Whale kind of run to the top of the standings instead.
As usual, please comment below if you’ve seen any other playoff prediction models out there!