I wish I could say that taking a league from one with delayed basic box scores to one that has a whole array of advanced stats takes a village.
In reality, it takes one person, three to four pieces of paper per game, some horrendously written code, and the willingness to accept that if you don’t do this then it’s not getting done. Possibly ever.
People may argue that there aren’t enough bodies or brains to compute stats in women’s hockey. This article is about refuting that idea.
We’ve all heard women’s hockey can’t have advanced metrics or even something as simple as shot tracking because there simply aren’t enough people. We’ve all heard it, heck I’m pretty sure I’ve said it more than once. But, if the last six months have taught me anything it’s that sometimes you just have to try.
A little background first. In the second half of 2017, I completed my Graduate Certificate in Sports Analytics. It’s by no means a requirement to do what I have done (anyone can track data, I’ll get back to that later) but it’s where I first got introduced to data tracking.
I started with following Aussie Rules Football players on the screen as they ran, kicked, and punted the ball across the 50-meter line. I spent whole games with a sheet in front of me, marking down what happened.
For my final in my data analysis course, I tracked four AWIHL (Australian Women’s Ice Hockey League) matches post-game, looking at each team’s power-play chances,and where they came from. I guess that was the beginning of this, even if I didn’t know it at the time.
In the winter of 2018 I ended up working 30 AIHL (Australian Ice Hockey League, the men’s league) games. I spent most of them in the commentary booth, on a stool I swiped from the VIP area so that I could rest my notepad on my knees and still see over the bar onto the ice.
The early days of me tracking were just little x’s and o’s. As the season wore on they became actual numbers with symbols scribbled around them to mark things like strength state and shot attempt. My little notebook made it look like I was going slightly insane: page after page of identical hand-drawn rinks, each covered with markings that were barely decipherable to me let alone to anyone else.
As the men’s hockey season ended and puck drop for the AWIHL loomed closer and closer, tracking games still wasn’t really something I had considered.
Instead, launching Even-Strength was eating up a solid 90% of my free time. It wasn’t until I was contacted by a representative of Ice Hockey Australia asking what the AWIHL needed to do in order to be viable on Even-Strength that I started thinking about it.
In the end, that line of questioning ended the same way it always does with the words ‘not enough people’ and ‘not enough time.’ But by then the idea was stuck.
The tracking sheets I use aren’t anything new; the NCAA has been distributing them for years, and honestly, they are very straightforward. I’ll admit I use a slightly modified version that has changed a bit as the season has gone on, but the original is still more than sufficient.
My process during the game, however, is probably a little different to most. First, I’m not actually at the rink where the game is being played. Second, I’m one of the league’s two commentators. This means I’m sitting in my chair at the far end of the booth with equipment and paperwork in front of me for every minute of the game and a significant portion of the intermissions.
With everything ‘official’ I need taking up the majority of my desk space, there’s not really any space for the tracking sheets. Usually I just have my one for that period perched on my knees, my pen tracking the play across the paper in what some people have described as frankly unnerving.
I track live, which means I’m tracking as the game is happening, and despite the joy of the occasional replay I am unable to go back and triple-check who took that shot if I’m not sure. Thus, during the game, I rely predominantly on only myself for tracking information. If I don’t see a player make a shot they didn’t make it, but working in such a high-pressure situation has definitely made me lean more on my play-by-play counterpart and my growing knowledge of players’ shooting patterns/team systems.
For example, knowing a team’s play structures, lines, and power play units can make it significantly easier to work out who just had a beautiful shot on goal even when I can’t see the number clearly. It’s a learning curve, and with each game, I get a little bit more accurate with a few less cross marks on the page from shots I never quite managed to identify.
After the game it’s just a matter of collating the paper, grabbing the boxscore from the scorekeepers to make sure I didn’t make any errors about the goal scorers, and entering the data so that the computer can do its thing. For shot locations, I use the ShotPlot tool that Andrew Pucci so kindly made earlier in the year after I mentioned on Top Shelf that I thought it was something that could be really useful to ‘grassroots’ analytics league.
Going team by team, period by period, I plug in the shot locations, flipping the paper for the second period so that each team’s shots stay at one end of the rink. While transcribing the shot locations I also have a spreadsheet open, entering the team, period, player and outcome of each and every shot. Once every shot on goal is registered in ShotPlot it’s just a matter of downloading the data and syncing it up with the Excel sheet I already have open.
With all the raw data now collated, it’s time to start making it accessible to the public, rather than just a very large spreadsheet of numbers that make sense to pretty much no one. I take a screenshot of the ShotPlot graphics and pop it into a Photoshop template to make the game-by-game shot charts I post on my Twitter.
Next, I add all the new data from Excel into the to the Master Sheet, while also adding in data like the game’s date and its location. Additional context data is also added from the box score, such as the secondary players from goals as well as which goaltender faced the shot. Lastly every play is given its own individual ID number.
Now at this point, I’m sure you’re all going, “Alyssa this is the most convoluted workflow.” Well kind reader, please hold onto your hats, because it is about to get a whole lot worse.
In order to synchronise the X and Y coordinates between the teams and find the ‘true’ XY, we run the data through R (while also producing xG at the same time but honestly that’s less important). To do this we use the Google Sheets package, which means R grabs the data from the master file on my Google drive, pulls it into R and runs it through the program.
However, because R lives to cause me pain, instead of just adding some new columns to my spreadsheet with Google’s update function, R instead needs to export the data to a CSV file. It then uploads that data as a new file because, for some awful reason, the Google Sheets update function takes a minimum of two minutes a row and times out after an hour AND I have over 1000 separate game events and counting.
Of course there’s some other stuff happening there as well; the main master sheet does get split into approximately for different spreadsheets while exporting from R so that I can draw both player specific and goalie specific data into Tableau (tutorial coming soon) more easily. The bones remain the same in V2.0 as it was in V1.0 with the goal of best visualising shot location, rates, and quality of shots on an individual, team, and goaltender level.
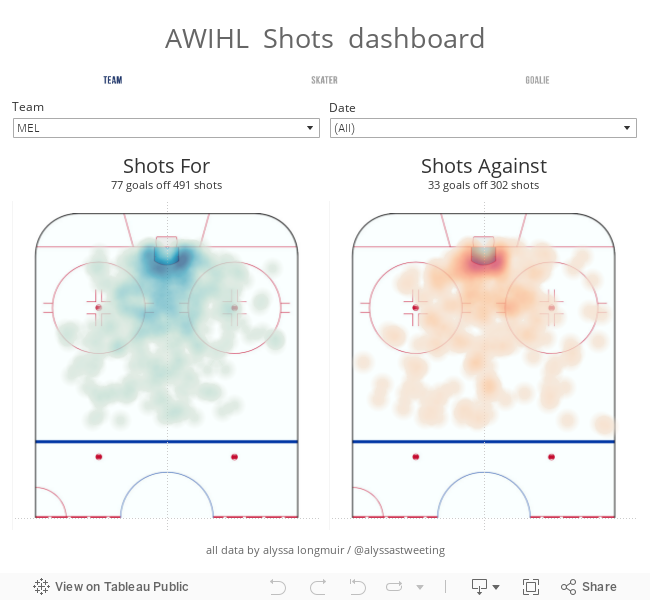
Sometimes, and not to sound like a hockey player while saying this, you really just have to pick up your team (or league) put them on your back, and just go for it. I’m not saying it’s going to be easy. If you read the above and still think it is, please go read it all again. People have been doing this very same thing for decades, pushing sport forward inch by inch.
What I’m doing isn’t new nor is it particularly special, but like so much in women’s sports it’s still groundbreaking. Nothing close to this has never been done in the AWIHL, definitely not on a league-wide level.
When I jokingly pitched this story on Twitter, the title I gave it was “A guide to dragging your barebones stats league into the analytics era.” And yes, ‘analytics era’ is definitely a stretch when we’re not even at the NWHL’s level yet, and definitely nowhere near that of professional North American men’s leagues. I’m one person: I cannot also attach times to each shot, monitor faceoffs and somehow also track shifts as much as I’d like to, but in the space of just a couple of months, there’s more data available about a women’s hockey league in Australia than there was before.
That isn’t to slight other league, because the argument ‘there’s just not enough people’ unfortunately still rings true. That said, it takes one person to start, a serious dose of determination, and a willingness to literally drag a league on a journey whether they’re ready or not. I’m glad I did it, even if I’m still sinking more hours a week than I care to admit where my mother can admonish me for it into this project.
So in summary and for those who kept asking what the workflow looks like— this is it.
Track game on tracking sheets stolen from the NCAA (three pages per game + one more if goalie pulled)
Retrieve XY coordinates using Andrew Pucci’s ShotPlot tool
Record player data and shot outcomes
Merge with XY data
Upload XY data into Master Sheet in the cloud
Create shot plot graphic for Twitter in Photoshop
Pull data from cloud into R Studio
In RStudio Create ‘True’ XY coordinate + xG
RStudio to create a new sheet in cloud
Tableau to pull updated data from cloud and display visualisations
Weep.
(It should be noted that this entire workflow should be read in the voice of Claire from Bon Appetit when she reads out the recipes at the end of her gourmet food experiments.)
I’m not going to sit here and say that doing all this by yourself is easy, but I’m also not going to act like I’m doing something so mind blowingly individual that no one else could possibly do this themselves. All you need to track is a note pad and some badly-drawn rinks, or if you’re feeling fancy, a folder full of slightly modified NCAA tracking sheets. Regardless, if you’re looking at getting into tracking feel free to reach out; I will admit that most of what I know is crammed into what you just read, however if you’re looking at setting up tracking sheets for something specific, either paper or spreadsheet-wise, I’m more than happy to help in any way that I can just come find me on twitter.
In closing, here’s a tip gleaned from my experiences: buy yourself some good pens that don’t smudge. You’re going to need them. Happy tracking!