There are only a few short days until the inaugural PWHL draft on September 18th and fewer weeks until the very first team training camps begin on November 13th. Normally, teams in pro sports have months on end to carefully plan draft and free agency strategy, but PWHL GMs and their staff face the unique challenge of planning theirs in a fraction of that time.
Additionally, they must adhere to the rules laid out in the PWHL’s CBA, which state in Articles 7 and 8 that for the first year:
- Minimum base salary must be $35,000
- No more than 9 players can make the minimum base salary
- A minimum of 6 players per team must make $80,000 or more
- Average salary for each team will be $55,000 (this is interpreted to be exactly $55,000 for the purposes of this article)
- Only the salaries of the 23 players on their active roster on the first day of the season are counted for these requirements (teams are required to take 28 players to training camp though)
It’s important to note that incentive and/or performance bonuses are not governed by the CBA, except in the case of the league awards, All-Star Game, or any other tournaments that teams participate in. Therefore, it’s possible that players will get significant salary bumps through these performance bonuses on top of the base salary that they sign for.
With that understanding, below is the data-driven salary structure I developed following these rules.
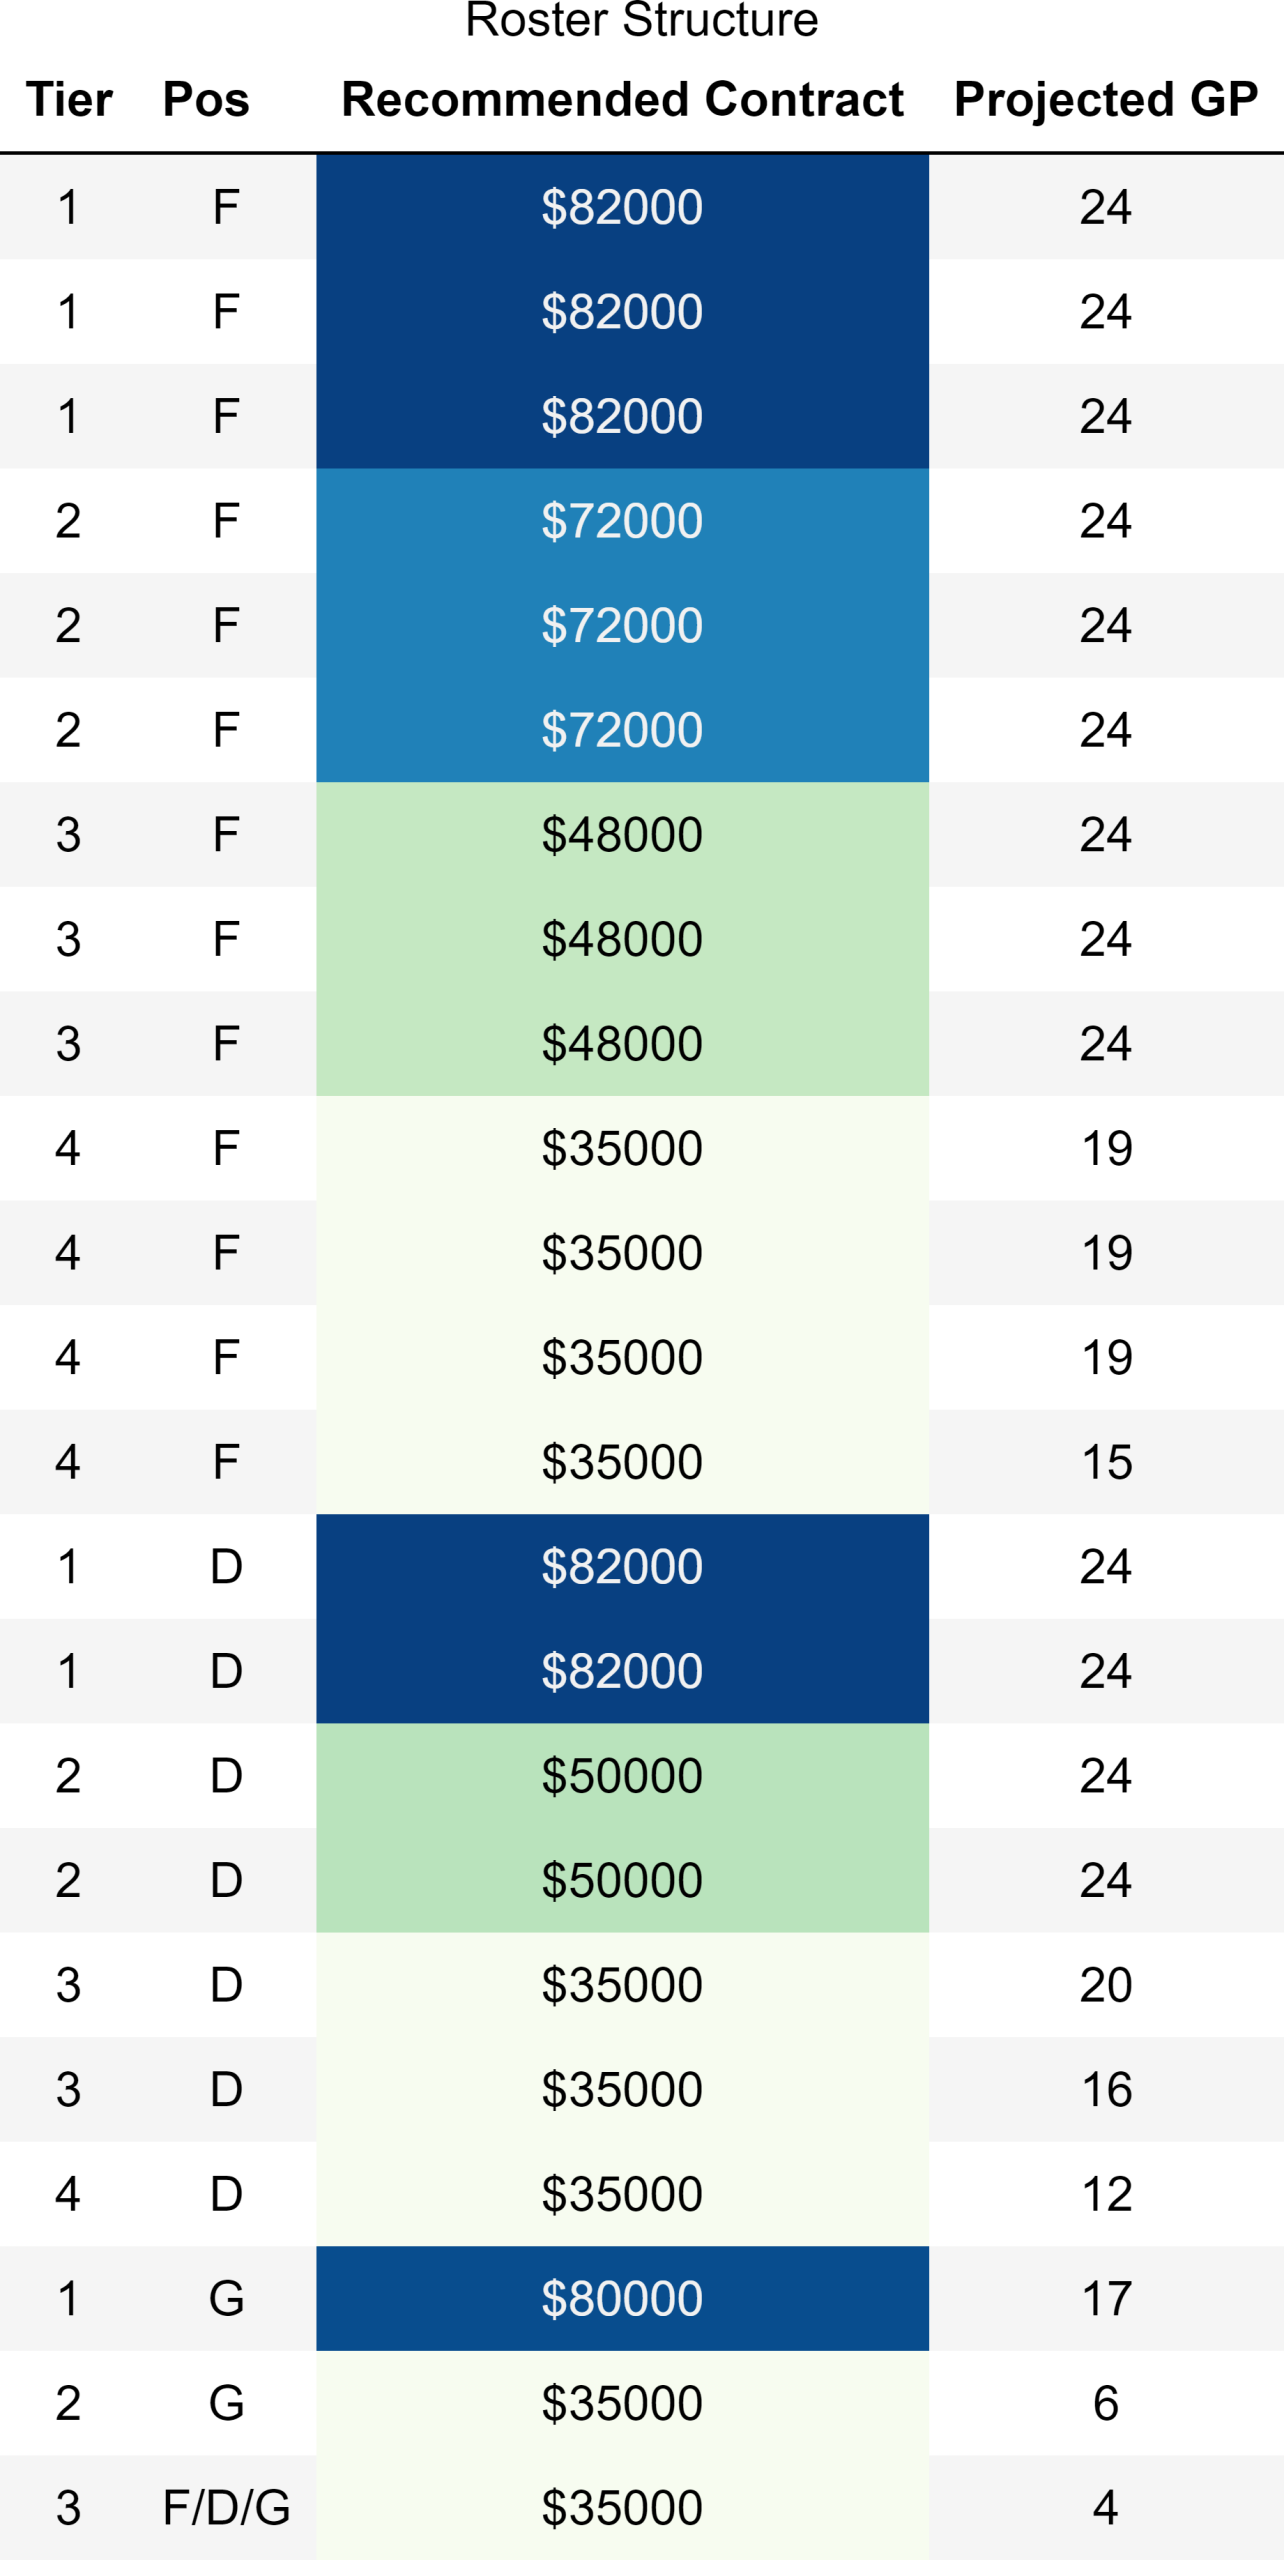
For reasons explained further in this article, each line has a recommended contract value based on players in the PWHPA who played on or should have played on that line. Goalies are excluded from the data-driven portion of this, since goalie analytics have yet to really develop for women’s hockey, and instead are simply assigned base maximum and the minimum contract values to round out the roster.
To build this data driven roster, I first needed to understand what fraction of team wins each line is responsible for. After some discussions with Ben Howell, we came up with a way to measure the impact each action a player takes in terms of adding or losing win probability and using that to measure team win contribution. However, a project like that takes much longer than a week to produce, and I was in a time crunch.
Instead, for this I used the expected threat metric (xT) developed by Max Tixdor and François Kik for the WHKYHAC Viz Launchpad competition, in which they won Most Innovative project. You can check out their interactive tool here.
This metric generally determines how likely a sequence of actions during a play will lead to a goal, and through looking at a players’ total xT when they’re involved in a play can tell us good they are at defending to gain possession and start a play or taking offensive actions that are likely to end in goals. Read more about Max & François’ project here.
Since xT for each player was already generated by those two, the next steps were to find how much each player is above or below average in terms of contribution to team wins. We’re using this method because the “cap” limits in the PWHL are based on ending with an average salary of $55,000, and by assuming the average player makes the $55,000, we can assign a contract value to every non-average player by understanding how much they differ from average performance.
This part of the process went as follows:
- Add together each player’s xTp to get the team xTt
- Divide team xTt by number of team wins Wt (= xTt/Wt)
- Divide each player’s xTp by number of wins they personally participated in Wp (= xTp/Wp)
- Multiply these two fractions together to get the % share of team wins (WS) for each player WS (= xTt/Wt * xTp/Wp)
- I then found how much each player’s WS varied from the average and multiplied by $55,000 to get their recommended contract value.
The result of this ended in a very stratified set of contract recommendations, one being as low as $5,270 to one as high as $124,787.12. I’ll let you guess who that highest one was; check the spreadsheet to see if your answer was correct. The low end values were most often due to a low number of games played and/or a low number of wins participated in.
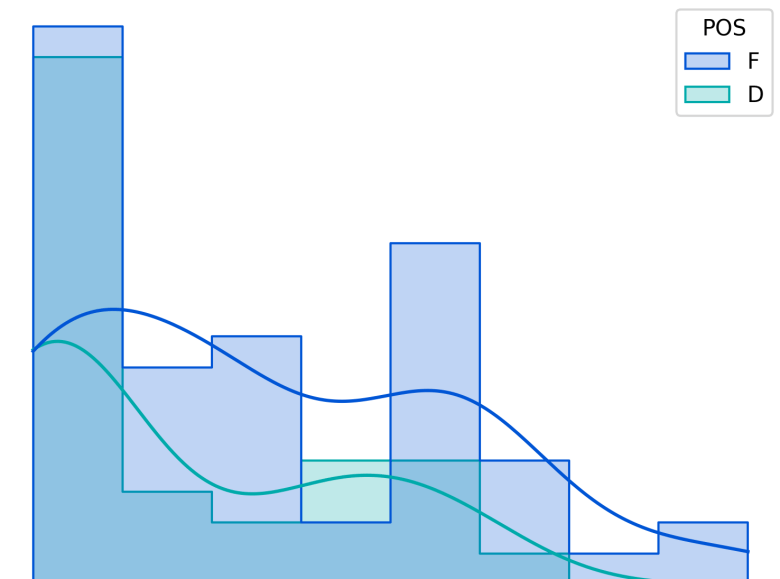
More importantly, this spread does not adhere to the CBA’s rules, so any salary under $35,000 was bumped up to that minimum in my spreadsheet to make sure it complied. Defenders additionally had consistently lower contract values compared to the forwards that they’re often said to be equal to performance wise. This is likely caused by Max and François’ model not fully accounting for defensive ability, which is so notoriously hard to measure that our NHL counterparts have only begun to fully quantify it recently.

To fix this without building another defensive ability model entirely, I turned to a simpler metric that defenders routinely get more credit in than forwards: time on ice (TOI). Players should also be paid proportionally if they’re spending more time putting their bodies on the line, so this seemed like a good way to rescale the uneven defender contract values to make the two distributions more similar.
To do this, I simply calculated how much each defender’s TOI varied from the average player’s and multiplied by their previously recommended contract value to get their new one.

This had a better distribution of contract values more similar to the forwards’, and once again I rounded any salaries under $35,000 up to the minimum. You can find these contract recommendations for all PW players here under the “All PW Skaters” tab.
Now that I had all these lovely recommendations, it was time to compile them to calculate how an average PWHL team should pay their lineup. Because there is so much fluctuation about who’s the #1 or #2 talent on a team in the PWHPA, I decided it was smarter to simply assign players to a line or d-pairing by hand based on their time on ice and performance. From there, I averaged across all the PWHPA teams for each line.
Lastly, I had to put a cap of $82,000 on the recommended contract values for the #1 lines and d-pairings. The level of talent players like Marie-Philip Poulin and Emily Brown bring to the table is so high that it would require a majority of the roster to make the minimum salary just to accommodate their recommended contracts. This is also against the rules, because only 9 players are allowed to have $35,000 contracts.
With this, we have the first data-driven PWHL roster salary structure, which I’ll put here again.

When actually using this, there will be times where individual player’s recommended contracts are larger or smaller than the average line’s. In that case, lines can be scaled to pay one player more or one player less on an individual basis as GMs are putting their rosters together.
I also want to note that I made a crucial assumption in this analysis that the PWHL teams will generally be built like Dream Gap tour teams in the sense that the gap in talent between the best player and worst player on a PWHPA team is similar to that on a PWHL team. This could be somewhat untrue, but I didn’t have another option to assume team structure will look like say, a PHF team, because we simply do not have data from another league detailed enough to build a reliable xT model for it. Thanks again to Sportlogiq, the PWHPA, and Jayna Hefford for providing the dataset that this article is based on.
If you’d like to play with these projections yourself, you can make a copy of the Excel file with all the formulas I used here.